The Effect of Sucrose Concentration on the Rate of Osmosis
Posted on Feb 15, 2024 by Danny

Potato and Carrot Slices Osmosis Lab Report
Are you looking for the best potato osmosis lab report help? You have come to the right place. Below is a full guide on how you can write your potato or carrot osmosis lab report.
Introduction
The experiment aimed to explore the effect of sucrose solution concentration on the rate of osmosis in potato and carrot slices. The experiment used 5 different potato slices and 5 different carrot slices placed in a 0%, 25%, 50%, 75% and 100% concentrated sucrose solution. Each slice was named Red, Green, Blue, White, and Yellow. The independent variable was the concentration of the sucrose solution, and the dependent variable was the change in mass.
Theory
Osmosis is the movement of water particles from a low sugar concentration to a high sugar concentration through a semipermeable membrane. Apart from sucrose solution concentration, other factors, such as temperature and the size of the particles, affect the rate of osmosis. As the concentration of the sucrose solution is increased, the difference in mass of the potato/carrot increases. This is because the sucrose solution is hypertonic, indicating a high concentration of dissolved particles compared hypotonic solution with fewer dissolved particles. Besides, when a potato/carrot slice is placed in a solution with the same water potential, this is regarded as an isotonic solution. When a potato/carrot slice is placed in a concentrated sucrose solution that has a higher water potential, then the water particles move from the potato/carrot slice to the solution. This results in a decrease in the final mass of the potato/carrot slice.
Hypothesis
This experiment hypothesizes that (a) the mass of the potato/carrot slice will decrease when placed in sucrose solution with a higher water potential (hypertonic solution), (b) the mass of the potato/carrot slice will not change when placed in an isotonic solution and (c) the mass of the potato/carrot slice will increase when placed in a sucrose solution with lesser water potential (hypotonic solution).
Data Collection
Table 1: The Rate of Osmosis in a Potato Slice when placed in different concentrations of sucrose solution.
|
Sucrose concentration |
Potato Initial Mass (g) |
Potato Final Mass (g) |
|||||||||
|
Red |
Green |
Blue |
White |
Yellow |
Red |
Green |
Blue |
White |
Yellow |
||
|
0% |
Exp 1 |
3.32 |
3.11 |
2.95 |
2.96 |
2.97 |
3.81 |
3.65 |
3.41 |
3.17 |
3.38 |
|
Exp 2 |
2.87 |
3.06 |
3.03 |
2.88 |
3.03 |
3.34 |
3.52 |
3.50 |
3.30 |
3.55 |
|
|
25% |
Exp 3 |
3.18 |
2.96 |
3.10 |
3.21 |
3.24 |
3.16 |
2.90 |
3.05 |
3.16 |
3.15 |
|
Exp 4 |
3.30 |
3.11 |
3.07 |
3.20 |
3.57 |
3.23 |
2.99 |
3.03 |
3.12 |
3.52 |
|
|
50% |
Exp 5 |
2.91 |
2.89 |
3.22 |
2.79 |
3.09 |
2.36 |
2.38 |
2.49 |
2.17 |
2.49 |
|
Exp 6 |
3.10 |
3.41 |
2.83 |
2.91 |
2.84 |
2.41 |
2.60 |
2.12 |
2.21 |
2.24 |
|
|
75% |
Exp 7 |
3.30 |
3.00 |
3.18 |
3.39 |
3.25 |
2.32 |
1.97 |
2.10 |
2.29 |
2.17 |
|
Exp 8 |
2.54 |
3.45 |
3.00 |
2.69 |
3.53 |
1.75 |
2.17 |
1.95 |
1.8 |
2.44 |
|
|
100% |
Exp 9 |
2.70 |
2.89 |
2.49 |
2.60 |
2.66 |
1.81 |
1.90 |
1.56 |
1.51 |
1.63 |
|
Exp 10 |
2.82 |
3.33 |
3.09 |
3.47 |
2.80 |
1.80 |
2.30 |
2.02 |
2.08 |
2.01 |
|
Table 2: The Rate of Osmosis in a Carrot Slice when placed in different concentrations of sucrose solution.
|
Sucrose concentration |
Carrot Initial Mass (g) |
Carrot Final Mass (g) |
|||||||||
|
Red |
Green |
Blue |
White |
Yellow |
Red |
Green |
Blue |
White |
Yellow |
||
|
0% |
Exp 11 |
2.51 |
3.00 |
2.63 |
2.88 |
3.10 |
2.95 |
3.36 |
2.93 |
3.15 |
3.43 |
|
Exp 12 |
1.99 |
2.60 |
2.66 |
3.03 |
2.91 |
2.26 |
2.91 |
3.07 |
3.41 |
3.23 |
|
|
25% |
Exp 13 |
3.54 |
3.71 |
3.54 |
3.28 |
3.37 |
3.37 |
3.79 |
3.65 |
3.32 |
3.40 |
|
Exp 14 |
3.30 |
3.42 |
2.86 |
3.22 |
2.79 |
3.30 |
3.48 |
2.92 |
3.31 |
2.92 |
|
|
50% |
Exp 15 |
3.00 |
2.90 |
3.04 |
2.97 |
2.98 |
3.08 |
3.05 |
3.15 |
3.01 |
2.99 |
|
Exp 16 |
2.64 |
3.15 |
3.34 |
2.51 |
3.22 |
2.44 |
2.80 |
3.17 |
2.20 |
3.26 |
|
|
75% |
Exp 17 |
3.98 |
3.32 |
3.58 |
3.40 |
3.53 |
3.41 |
2.83 |
2.88 |
2.91 |
2.90 |
|
Exp 18 |
2.98 |
2.99 |
2.69 |
3.72 |
2.90 |
2.40 |
2.36 |
2.28 |
2.91 |
2.29 |
|
|
100% |
Exp 19 |
2.36 |
2.21 |
1.95 |
2.29 |
2.36 |
1.05 |
1.56 |
1.43 |
1.60 |
1.78 |
|
Exp 20 |
2.51 |
2.76 |
3.65 |
3.12 |
3.58 |
1.91 |
2.06 |
2.73 |
2.50 |
2.75 |
|
Data Processing
This section processes the above-collected data. From the data collection results, both potato and carrot slices had different final masses compared to their initial mass. Hence, the change in mass can be calculated by subtracting the final mass from the initial mass. Besides, the percentage change in mass can be calculated by dividing the change in mass by the initial mass, then multiplying by 100. The average % change in mass will be calculated by adding the individual percentage changes in mass for Red, Green, Blue, White, and Yellow, then dividing by 5.
Δ Mass = Final Mass – Initial Mass
Percentage Δ Mass = Δ Mass/Initial Mass * 100
The average percentage Δ mass = Total of % Δ mass for Red, Green, Blue, White, and Yellow/5.
Table 3: The change in mass and percentage change in mass for potato slices.
|
|
Red |
Green |
Blue |
White |
Yellow |
|
|||||
|
Sucrose conc’n |
Δ mass |
% Δ mass |
Δ mass |
% Δ mass |
Δ mass |
% Δ mass |
Δ mass |
% Δ mass |
Δ mass |
% Δ mass |
Average % change |
|
0% |
0.49 |
14.75 |
0.54 |
17.36 |
0.46 |
15.59 |
0.21 |
7.09 |
0.41 |
13.80 |
13.72 |
|
0.47 |
16.37 |
0.46 |
15.03 |
0.47 |
15.51 |
0.42 |
14.58 |
0.52 |
17.16 |
15.733 |
|
|
25% |
-0.02 |
-0.62 |
-0.06 |
-2.02 |
-0.05 |
-1.61 |
-0.05 |
-1.55 |
-0.09 |
-2.77 |
-1.72 |
|
-0.07 |
-2.12 |
-0.12 |
-3.85 |
-0.04 |
-1.30 |
-0.08 |
-2.5 |
-0.05 |
-1.40 |
-2.24 |
|
|
50% |
-0.55 |
-18.9 |
-0.51 |
-17.64 |
-0.73 |
-22.67 |
-0.62 |
-22.22 |
-0.6 |
-19.41 |
-20.17 |
|
-0.69 |
-22.25 |
-0.81 |
-23.75 |
-0.71 |
-25.08 |
-0.7 |
-24.05 |
-0.6 |
-21.12 |
-23.26 |
|
|
75% |
-0.98 |
-29.69 |
-1.03 |
-34.33 |
-1.08 |
-33.96 |
-1.1 |
-32.44 |
-1.08 |
-33.23 |
-32.73 |
|
-0.79 |
-31.10 |
-1.28 |
-37.10 |
-1.05 |
-35 |
-0.89 |
-33.08 |
-1.09 |
-30.87 |
-33.43 |
|
|
100% |
-0.89 |
-32.96 |
-0.99 |
-34.25 |
-0.93 |
-37.34 |
-1.09 |
-41.92 |
-1.03 |
-38.72 |
-37.04 |
|
-1.02 |
-36.17 |
-1.03 |
-30.93 |
-1.07 |
-34.62 |
-1.39 |
-40.05 |
-0.79 |
-28.21 |
-34 |
|
Table 4: The change in mass and percentage change in mass for carrot slices.
|
|
Red |
Green |
Blue |
White |
Yellow |
|
|||||
|
Sucrose Conc’n |
Δ mass |
% Δ mass |
Δ mass |
% Δ mass |
Δ mass |
% Δ mass |
Δ mass |
% Δ mass |
Δ mass |
% Δ mass |
Average % change |
|
0% |
0.44 |
17.53 |
0.36 |
12 |
0.3 |
11.41 |
0.27 |
9.38 |
0.33 |
10.65 |
12.19 |
|
0.27 |
13.57 |
0.31 |
11.92 |
0.41 |
15.41 |
0.38 |
12.54 |
0.32 |
11 |
12.89 |
|
|
25% |
-0.17 |
-4.80 |
0.08 |
2.16 |
0.11 |
3.11 |
0.04 |
1.22 |
0.03 |
0.89 |
0.51 |
|
0 |
0 |
0.06 |
1.75 |
0.06 |
2.10 |
0.09 |
2.80 |
0.13 |
4.66 |
2.26 |
|
|
50% |
0.08 |
2.67 |
0.15 |
5.17 |
0.11 |
3.62 |
0.04 |
1.35 |
0.01 |
0.34 |
2.63 |
|
-0.2 |
-7.58 |
-0.35 |
-11.11 |
-0.17 |
-5.09 |
-0.31 |
-12.35 |
0.04 |
1.24 |
-6.98 |
|
|
75% |
-0.57 |
-14.32 |
-0.49 |
-14.76 |
-0.7 |
-19.55 |
-0.49 |
-14.41 |
-0.63 |
-17.85 |
-16.18 |
|
-0.58 |
-19.46 |
-0.63 |
-21.07 |
-0.41 |
-15.24 |
-0.81 |
-21.77 |
-0.61 |
-21.03 |
-19.72 |
|
|
100% |
-1.31 |
-55.51 |
-0.65 |
-29.41 |
-0.52 |
-26.67 |
-0.69 |
-30.13 |
-0.58 |
-24.58 |
-33.26 |
|
-0.6 |
-23.90 |
-0.7 |
-25.36 |
-0.92 |
-25.21 |
-0.62 |
-19.87 |
-0.83 |
-23.18 |
-23.51 |
|
Table 5: Standard Deviation for each Average Percentage change for Potato Slices.
|
Sucrose conc’n |
|
Average % change |
Standard deviation (g) |
|
0% |
Exp. 1 |
13.72 |
3.929556 |
|
Exp. 2 |
15.733 |
1.038785 |
|
|
25% |
Exp. 3 |
-1.72 |
0.781252 |
|
Exp. 4 |
-2.24 |
1.034894 |
|
|
50% |
Exp. 5 |
-20.17 |
2.179977 |
|
Exp. 6 |
-23.26 |
1.563094 |
|
|
75% |
Exp. 7 |
-32.73 |
1.845157 |
|
Exp. 8 |
-33.43 |
2.645407 |
|
|
100% |
Exp. 9 |
-37.04 |
3.575653 |
|
Exp. 10 |
-34 |
4.60143 |
From the standard deviation results, Exp. 3 can be regarded as the most accurate experiment for the potato slices since it has the lowest standard deviation of 0.781252.
Table 6: Standard Deviation for each Average Percentage change for Carrot Slices.
|
Sucrose conc’n |
|
Average % change |
Standard deviation (g) |
|
0% |
Exp. 11 |
12.19 |
3.141437 |
|
Exp. 12 |
12.89 |
1.693321 |
|
|
25% |
Exp. 13 |
0.51 |
3.095343 |
|
Exp. 14 |
2.26 |
1.690663 |
|
|
50% |
Exp. 15 |
2.63 |
1.894279 |
|
Exp. 16 |
-6.98 |
5.418538 |
|
|
75% |
Exp. 17 |
-16.18 |
2.385162 |
|
Exp. 18 |
-19.72 |
2.640663 |
|
|
100% |
Exp. 19 |
-33.26 |
12.63401 |
|
Exp. 20 |
-23.51 |
2.225071 |
From the standard deviation results, Expt. 14 can be regarded as the most accurate experiment for the carrot slices since it has the lowest standard deviation of 1.690663.
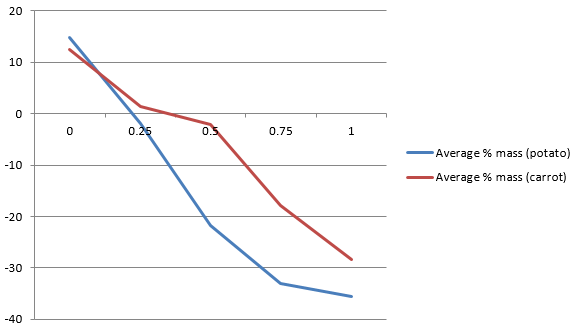
Table 7: Average % change in mass for potato and carrot slices for each sucrose solution.
|
Sucrose Conc’n |
Average % Mass (Potato) |
Average % Mass (Carrot) |
|
0% |
14.7265 |
12.54 |
|
25% |
-1.98 |
1.385 |
|
50% |
-21.715 |
-2.175 |
|
75% |
-33.08 |
-17.95 |
Graph 1: The effect of sucrose solution on the average percentage change in mass of potato and carrot slices.
Conclusion
To conclude, it is evident that the percentage of sucrose concentration affects the rate of osmosis. The experiment used 5 different potato slices and 5 different carrot slices. The different slices were named Red, Green, Blue, White, and Yellow. Each of the slices was subjected to 0%, 25%, 50%, 75%, and 100% concentrated sucrose solutions.
The effect of sucrose solution on the rate of osmosis was clearly evident for 0% and 100% concentrated sucrose solutions. For 0% concentrated sucrose solutions, the slices tended to gain more weight compared to 100% concentrated sucrose solutions, where the slices lost weight. Besides, for 0% and 100% concentrated solutions, a substantial percentage change in mass was observed.
These observations are in line with the osmosis principle that states that an increase in the concentration of sucrose solutions increases the water potential of the potato’s particles. As a result, water moves out of the potato particles towards the concentrated solution.
Evaluation
- The different potato and carrot slices used could have a different amount of nutrition, which would affect the rate of osmosis.
- Sugar surrounding the slices might not be equally distributed, resulting in different working scenarios for each slice.
- The rate of osmosis could have been affected by the varying temperatures of the surroundings, resulting in different results.
References
Phuntsho, S., Sahebi, S., Majeed, T., Lotfi, F., Kim, J. E., & Shon, H. K. (2013). Assessing the major factors affecting the performance of forward osmosis and its implications on the desalination process. Chemical Engineering Journal, 231, 484-496.
Winfield, B. A. (1979). A study of the factors affecting the rate of fouling of reverse osmosis membranes treating secondary sewage effluents. Water Research, 13(7), 565-569.
Testimonials
GIS can be overwhelming, but this team made it so much easier. Their assistance in data analysis and map creation was top-notch. I'm grateful for their expertise!
My professor gave positive recommendations on how you edited my entire thesis. I expect my thesis to get approval from the committee without any revisions. Thank you for your unbelievable help.
I was struggling with my GIS assignment, but this service came to the rescue! Their expert guidance and well-explained solutions made a complex subject feel manageable. Thank you for the support!
Thank you, Custom Papers Writing Help, for the excellent assistance with my assignment. I will always seek your help when I am stuck.
Trustworthy Services
- Get 24/7 assistance.
- Get a masterpiece of work.
- Step-by-step help.
- We meet your expectations.
- High-standard work.
- Expert writing & editing.
- Various discipline writers.
- Academic documents help.
- Scientific papers assistance.
- Professional documents aid.
How it Works
- Place an order.
- Make payment.
- Receive payment confirmation via email.
- The order is assigned to a writer.
- The writer delivers the first draft to an editor.
- The editor reviews the draft and requests changes.
- The writer makes changes and delivers the final draft.
- The final draft is delivered to you via email.
- Review the draft and request a revision within 1 month for free (very rare).
Any concerns? Contact Us or join our Live Customer Support platform.
Our Writers are Qualified
- Native English speakers
- Undergraduate, Master or PhD certified
Our Papers are Professional
- Plagiarism-free (original)
- Correct referencing (APA, Harvard, MLA, etc.)
- Use of graphics/ pictures/ images
- Correct grammar
- No typos
Get these Services for Free
- Title page
- Reference list
- Turnitin report
NB: Custom Papers Writing Help provides custom writing services for research and study assistance purposes only. Our uniquely created reports are meant to help students with the necessary guidelines for their academic coursework tasks.